
When a marketer or a skilled analyst opens Excel, their sharp, elegant movements may look like magic. If you break down their movements you’d experience a series of keyboard shortcuts, expert usages of formulas, subtle clicks of the mouse, and habits built over years of practice. One question I get asked most of the times is: what Excel skills are most crucial for marketers to learn?
Excel is a very valuable tool for various marketing tasks. The two most imperative uses that I have for Excel is first, as a research tool while writing (e.g. to get original insights for a blog), and maybe more obvious and more basic, for analyzing information and reporting.
With this in mind, here are some crucial tricks to help you get more proficient in Excel.
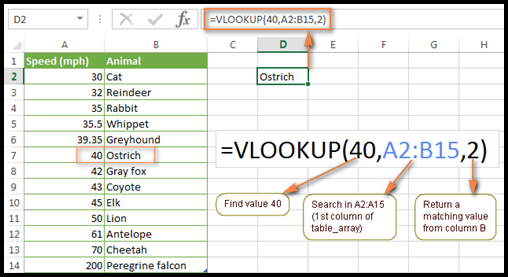
1. Using VLOOKUP Function:
This is truly a gift for a marketer. This amazing function is great for connecting and comparing various sets of data. Mostly, this formula works if a given value from one table exists in the first section of some other table, and after that returns a value from the second table. It can be used, for instance, to compare if new keywords you are planning to include, is already in an account; or, you can examine two different time frames.
VLOOKUP stands for vertical look-up – as in looking vertically down a section of data cells. On the other hand, HLOOKUP stands for level look-up – as in across a horizontal row.
Also Read: How to Convert Google Apps into CRM?
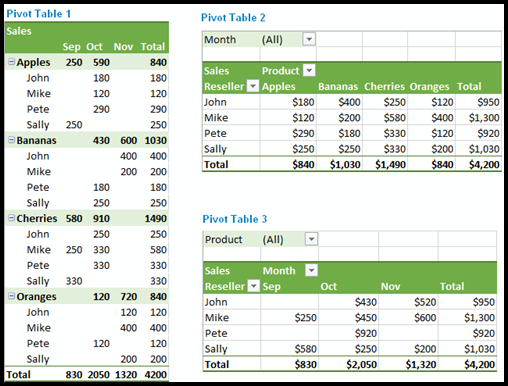
2. Summarizing Data with a Pivot Table:
A “Pivot Table” is a spreadsheet functionality that lets you characterize and arrange tabular data. Pivot tables are an extremely helpful and effective feature of MS Excel. They can be used to analyze, summarize, search and present your data. Data is valuable only if you can review and extrapolate important trends from it. Pivot Tables precisely help you do that.
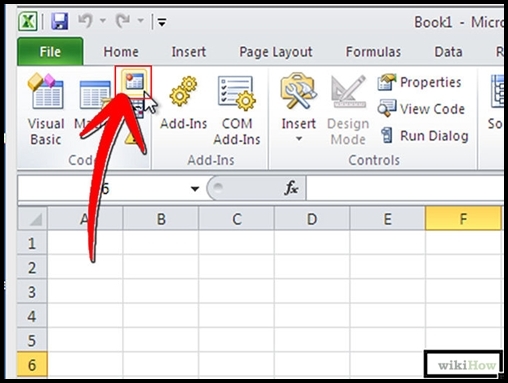
3. Programming Macro:
A macro is a program that records and consequently executes a series of commands (activities) with just one execution instruction (e.g. the click of a button). Macros have huge importance for marketers because they can make long manual processes simple by automating them.
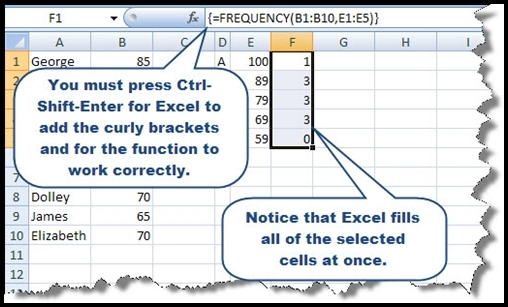
4. Creating Histogram with “=FREQUENCY” Function:
A histogram is a graphical representation (chart) of spreading data. A frequency distribution shows the quantity of data points that fall within the indicated ranges in a sample. A histogram is a helpful way to organize data into comparative groups (e.g. all grades from 90-100 are an “A” while those from 80-89 are a “B”). The range around “90” and “100” is known as a “bin.”
Since finance influences all the businesses, seeing how to read, create, and control data as a histogram is basic for entrepreneurs and marketers.
5. Creating Charts:
Most of the times, I see marketing data displayed to key stakeholders in tables when they must be presented visually. Even with vast datasets that don’t outline easily, it is possible to make use of conditional formatting to add some visual signs as a minimum to tabular data. Anyhow, in case you’re not managing an unwieldy dataset, you need to search for each opportunity possible to chart your data.
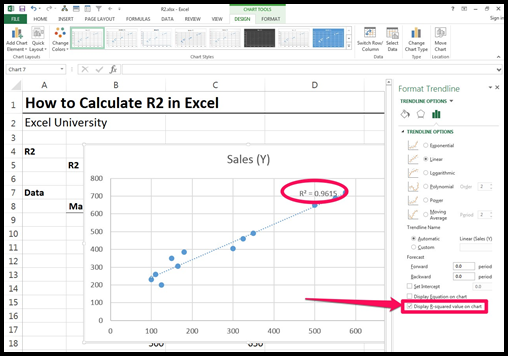
6. Regression Analysis and R2:
Regression analysis is a statistical procedure that analyzes the relationship between distinctive variables in a sample. Excel does the bigger part of the work for you. The crucial thing is to understand the importance behind the numbers that Excel outputs. It is of great importance to know that how much effect A is having on B (causation) or if A and B are inclining along similar ways without having a direct effect on each other (correlation). R2 is known as the coefficient of determination. It defines how well the data fits your selected model.
7. Keyboard Shortcuts:
Nobody likes to scroll. Everybody wants to save their time of scrolling for the whole day to the bottom of a spreadsheet. In order to get rid of this, here are a few keyboard shortcuts that will save time:
- CTRL + Home: To get to the first cell (top left) in your data set
- CTRL + down arrow: To get to the bottom row of your data set
- CTRL +up arrow: To get the top row of your data set
- CTRL + left arrow: To get to the first column of your data set
- CTRL + right arrow: To get to the last column of your data set
- CTRL + End: To get to the last cell (bottom right) in your data set
I hope this short primer on Excel would be of great benefit for you. As said above, these tricks can come in handy for marketers of all industries. GOOD LUCK!
Using Excel with Makesbridge:
Makesbridge allows you to use Microsoft Excel for your contacts management. If you have a list of contacts, you can easily import it into Makesbridge’s marketing automation engine and use for your drip campaigns. Similarly, if you are using Google Apps for Work, you can use them with Makesbridge as CRM. In addition, you can avail our Freedom Offer for Google Apps and enjoy Free subscription for Google Apps with Makesbridge.